When we invest, we’re really just trying to predict the future—hopefully, without making complete fools of ourselves in the process. But, as anyone who’s spent more than five minutes staring at financial statements knows, sometimes companies make that job surprisingly hard. One of the classic ways they do this is through intercorporate investments. Yeah, sounds fancy, right? It basically means a company investing in another company. Easy enough, until accounting rules get involved—then things start looking as clear as mud.
Recently, investors got a perfect dose of this confusion when Alphabet “surprised” everyone by reporting massive profits due to a valuation adjustment on its stake in SpaceX. Great news, right? Well, kinda. Because these profits were basically paper gains—not actual cash—leading plenty of people scratching their heads, trying to figure out if Alphabet just became magically more profitable overnight or if something else was going on. Another juicy example is Kelly Partners, an Australian serial acquirer of accounting businesses that some compounder bros love and trading at "just" 20 times EBITDA. A bargain?
So, here’s the deal. This article aims to demystify the accounting behind intercorporate investments and explain why the way companies report their stakes in other businesses can drastically change how investors should look at them. Because let’s face it—no one likes discovering that half of their beautifully cheap EBITDA is someone else's money.
And speaking of nasty accounting surprises, in our next article we’ll dive even deeper to explore how some companies have used intercorporate accounting to hide serious problems—and we'll see why plenty of accounting scandals trace their roots back precisely to these types of investments. Get ready for some memorable examples—because, sadly, accounting creativity isn’t always harmless.
Welcome to Edelweiss Capital Research! If you are new here, join us to receive investment analyses, economic pills, and investing frameworks by subscribing below:
Galileo before the Holy Office - Joseph-Nicolas Robert-Fleury, 1847
Course is only in Spanish
A comprehensive course designed to take you from beginner to professional level.
📚 What does it include? ✔ 84 hours of training ✔ 6-month duration ✔ 35 in-depth analyses of real companies ✔ 11 instructors: active analysts and portfolio managers ✔ Valuation models and templates ✔ 15 hours of personalized tutoring ✔ Q&A forum and community access ✔ Certificate upon completion ✔ Satisfaction guarantee
Some course instructors (including myself):
Some topics covered:
📈 Learn to invest like professionals, using real-world cases and a practical approach.
📅 The course starts tomorrow, May 5, and registration closes today, Sunday, May 4, at midnight (00:00).
If you want to make the most of it, you can still take advantage of a 20% discount off the course price using the code “adriariverocurso”.
🔗 All the information about the course can be found here:
And also, check out the FREE webinar I did together with Adrià and Leandro, where we discussed several investment opportunities:
Part 1: Basics of Intercorporate Investments
Before jumping into the mess of intercorporate accounting, let’s take a careful walk through how these investments actually work. Think of it as a quick accounting survival guide—only slightly less exciting than your favorite Netflix show.
When one company buys shares of another, accountants can’t just leave things simple (of course not). They created different ways to record these investments, depending mostly on how much influence the buying company has. And surprise, surprise—the accounting method chosen dramatically affects a company's reported earnings, debt load, and those oh-so-beloved valuation metrics like PE ratios, EBITDA, and free cash flow (FCF).
To keep things straightforward (or at least as straightforward as accounting ever gets), let's break it down into three main methods:
Cost/Fair Value Method (Passive investments, typically under 20% stake)
Equity Method (Investments with significant influence, usually around 20–50%)
Full Consolidation (Control, generally more than 50%)
Let’s dive into each, and see exactly why investors should care—because trust me, you should.
1.1 Cost/Fair Value Method (Minority stakes, passive)
This is your classic passive investment: buy some shares, sit back, and pray they go up. Usually, if you own less than 20% of another company and have no real say over its management, you’ll use this method.
How does this work in practice? At the start, your investment sits quietly on your balance sheet at whatever price you paid—simple enough. But then accountants introduced something called the "fair value" method. Basically, every reporting period you adjust your investment to reflect its market price. If shares double, congratulations, you just booked a nice unrealized profit. But here’s the catch: it’s just a paper gain. No cash magically appears in the company’s bank account.
Take Alphabet’s recent stake in SpaceX. When SpaceX was revalued upwards, Alphabet’s reported profits skyrocketed overnight—yet it was purely accounting magic. They didn’t sell the shares, so their cash flow didn’t change. No new dollars, just more digits on paper. Great for headlines, confusing for investors.
Impact on financial statements:
Balance Sheet:
Public Companies: Initially, your investment appears at purchase price, quietly as a long-term asset. But accountants love surprises—so every reporting period, they adjust your investment to reflect current market prices ("fair value"). If the share price goes up, your asset increases immediately. If it crashes, your asset value drops. These frequent adjustments mean your balance sheet fluctuates based entirely on market sentiment, not operational improvements—simple yet potentially misleading.
Private Companies: With private investments, there isn’t a ready-made market price—no public stock exchange quoting your asset value daily. Here, the fair value isn’t always clear. Typically, you record the investment at your original cost and leave it there until something significant happens—like the company raising more money at a new valuation, a clear impairment event (e.g., a disastrous earnings report), or a reliable independent appraisal. Only then do you adjust the asset's value, either upward or downward. As a result, private company valuations often remain stable (or stagnant) for extended periods—quietly sitting on your balance sheet, not drawing much attention…until suddenly they do.
Income Statement:
Public Companies: This is where things get interesting (or frustrating). Each period, your income statement records two things from these passive investments:
Dividends received: Actual, real cash in your bank account. Straightforward.
Unrealized gains and losses: Purely accounting-driven, market-price adjustments. Your investment jumps in price? Instant profits appear—though entirely on paper. Your cash position hasn't improved one bit, yet your earnings suddenly look fantastic, at least until market sentiment shifts again.
Because market-driven changes swing dramatically, reported earnings—especially non-operating income—fluctuate wildly. Investors may mistakenly believe your operational performance is improving when you're merely riding market waves.
Private Companies: Without a regular market price, your income statement usually remains quiet. Typically, you only recognize dividends or impairments as they actually occur. If the investee company distributes dividends (rarely seen with startups or growth-stage private companies), that's immediate, real income. However, any changes in value—upward or downward—generally happen infrequently, often tied to specific events (like new funding rounds, impairment triggers, or occasionally an annual independent valuation). Therefore, your earnings tend to remain relatively stable. When adjustments happen, they can come as a sudden shock: massive write-downs if things go south or sudden upward revaluations if the company successfully raises capital at higher valuations. Again, stability turns into surprise overnight.
Cash Flow Statement:
Public Companies: Finally, reality kicks in. Those fancy "unrealized gains". Accountants subtract them entirely here as non-cash adjustments. The only actual cash hitting your statement from passive investments is from dividends received. Investors focusing solely on earnings might find their imagined cash flows disappearing faster than temporary market gains.
Private Companies: Similar to publicly traded investments, private company unrealized valuation changes don't produce cash. Adjustments (positive or negative) disappear as non-cash items. Real cash flow appears only if dividends are paid—which, with private companies, is typically rare.
Why Should Investors Care?
Whether the investment is public or private, valuation adjustments under the cost/fair value method can create confusion and misleading signals. If you're calculating key valuation metrics (like PE multiples or margin trends), relying blindly on accounting valuations—especially those driven by fair value adjustments—can be dangerous. You might mistakenly believe you've discovered a growth engine or expanding margins, only to realize you're simply looking at temporary (or infrequent) paper gains.
1.2. Equity Method (Associates, typically 20–50%)
If your investment is significant enough that you can influence—but not control—the investee (usually owning around 20–50%), accountants switch to the equity method. Here, things get slightly trickier.
How does this work in practice? You initially record the investment at cost. But here’s the big difference: every year, you’ll pick up your share of the investee’s net income or loss in your own income statement. That’s right, if they make money, you do too (on paper). But again, this profit doesn’t always mean you’re getting cash—unless your investee pays out dividends.
For instance, say you own 30% of "Startup Inc." If they earn €1 million, you book €300,000 as income. Nice, right? But if they decide not to distribute dividends (classic startups, always reinvesting), you see zero cash. Yep, you just made €300k of "profits," but your bank balance stays exactly the same.
Impact on financial statements:
Balance Sheet: Initially, your investment is recorded at cost—easy enough. But from there, it gets trickier. Each year, your investment’s carrying value is adjusted based on your share of the investee’s net income or loss. Profits increase your investment value; losses decrease it. Simple, right?
But there's an ironic twist: receiving dividends actually reduces your balance-sheet investment value. Why? Accountants see dividends as your investee returning part of your original investment—so the more dividends you receive, the smaller your balance-sheet asset becomes. Yes, accountants can make even getting paid look like a drawback.
Income Statement: Unlike the cost method, your income statement under the equity method includes your share of the investee’s profits or losses directly in earnings. If you own 30% of "Startup Inc." and they make €1 million profit, your income statement now shows an extra €300,000.
If Startup Inc. chooses not to pay dividends (classic startup behavior, reinvesting every cent), you see none of that money. Your bank account stays exactly the same despite booking these lovely profits. Investors celebrating your earnings growth might wonder why your cash position isn't improving—hint: imaginary profits don’t pay the bills.
Cash Flow Statement: Your share of the investee’s profits, recorded so nicely on your income statement, is entirely non-cash. To show this reality, your cash flow statement removes these earnings adjustments, leaving only actual dividends received from the investee as real cash inflows.
The result? Investors must be extremely careful interpreting earnings and cash flows from equity-method investments. You might look highly profitable yet be completely cash-starved if dividends are minimal or nonexistent.
1.3. Full Consolidation (Control, usually more than 50%)
If you actually control the investee—usually meaning you own over half the shares—you consolidate. Think of it as marriage in accounting terms: two separate entities become one. But just like marriage, sometimes things can get complicated (financially, I mean!).
How does this work in practice? All the investee’s revenues, costs, assets, and liabilities fully merge into your financial statements. Everything. 100%. Even if you own just slightly more than half, you include the whole thing. And to make things even messier, accountants add something called "Non-Controlling Interests" (NCI) in equity, which represents the portion of the business you don’t actually own. Sounds simple? Wait until you see it in action.
Let’s take Brookfield, a company famous for owning large stakes in countless subsidiaries around the globe. Imagine Brookfield controls a subsidiary that owns an office building. That subsidiary financed the building using significant debt, but here’s the twist: this debt is non-recourse—meaning if the subsidiary defaults, lenders can only go after the building itself, not Brookfield’s other assets. Sounds great for Brookfield, right?
Well, yes—but here is the thing. Because of consolidation rules, Brookfield still must show the full amount of that debt on their consolidated balance sheet, even though legally it’s isolated. Multiply this scenario by hundreds of subsidiaries, each with its own complicated financing structure, and suddenly Brookfield’s balance sheet looks like an indecipherable financial puzzle.
This makes things extraordinarily tricky for investors. Sure, all that consolidated debt appears massive—potentially terrifying—but not all of it actually poses direct risk to Brookfield itself. Investors trying to separate the "real" risks from the "paper" ones must dive deep into the footnotes and subsidiary disclosures—a process about as fun as doing your taxes blindfolded.
Impact on Financial Statements
Balance Sheet: With consolidation, you fully absorb all assets and liabilities of your subsidiary—every last dollar. Suddenly, your balance sheet balloons, looking more impressive on one hand but potentially riskier on the other. Even if you own just slightly over half, you consolidate 100% of their debts. Investors casually glancing at your debt metrics might freak out, wondering when you suddenly borrowed so much money. Conversely, you might look asset-rich, but a chunk of those assets technically belongs to minority shareholders. To clarify this mess (or confuse further?), accountants place a line in equity called "Non-Controlling Interests" (NCI)—a reminder of what you don't fully own.
Income Statement: Under full consolidation, all subsidiary revenues and expenses combine with yours, dramatically inflating your top-line revenue, EBITDA, and net profits. If you own 51% of a business generating €50 million EBITDA, your EBITDA jumps by the full €50 million on paper. Great headlines follow: "record-breaking revenues and profits!" Yet, reality quickly sets in at the bottom line—profits belonging to minority shareholders get subtracted back out as "profit attributable to non-controlling interests."
The problem? Investors calculating valuation multiples from consolidated EBITDA might mistakenly think all that profit belongs to the parent company. Suddenly, your business looks cheaper and more profitable than it actually is, causing you (or other investors) to pay high multiples for earnings that aren't fully yours. This mistake happens more frequently than anyone likes to admit—dangerously easy to make if you’re not paying careful attention.
Cash Flow Statement: Consolidation brings all subsidiary cash flows directly into your statements, inflating your operating, investing, and financing cash flow metrics. On the surface, your free cash flow (FCF) might look exceptional—but be careful. Just like with EBITDA, part of that cash belongs to minority shareholders. Dividends paid to these minority investors become real cash outflows, directly reducing your available cash.
But here's where things get especially tricky: unlike net profit, where accountants clearly show exactly how much belongs to minority shareholders (the famous "profit attributable to non-controlling interests"), the cash flow statement offers no such neat separation. Yep, that's right—accountants kindly inform you precisely what share of profits isn't yours, but they conveniently leave you in the dark when it comes to cash.
The result? Investors see a consolidated FCF number but have virtually no way of quickly figuring out how much of it genuinely belongs to them. Suddenly, your seemingly great cash-generating investment doesn't look so straightforward.
Is there any solution to this headache? Unfortunately, accountants don’t make it easy (shocking, I know). The only real way to unravel this cash-flow mystery is by diving deep into financial disclosures and footnotes, looking for additional details about subsidiary distributions, dividends paid to non-controlling interests, and subsidiary-level cash positions. In practice, investors often approximate or estimate proportional ownership to figure out "economic" free cash flow—the actual cash flow available to shareholders of the parent.
But let's be honest: this detective work is tedious, complex, and far from perfect. Companies typically don’t volunteer this data neatly, and regulators don’t require it explicitly, leaving investors to piece together incomplete puzzle pieces.
So be wary of companies with numerous consolidated subsidiaries that choose not to voluntarily disclose how much FCF truly belongs to shareholders. Without clear disclosure, investors can’t effectively track real value creation, which should be at the core of any serious investing strategy. By the way, certain companies, like Constellation Software, actually go the extra mile and clearly disclose the exact free cash flow attributable to their shareholders, making investors' lives much simpler. Unfortunately, most companies aren't as transparent.
Summing up the Impact
Cost/Fair Value Method:
Balance Sheet: Investments fluctuate with market values.
Income Statement: Unrealized gains inflate earnings artificially.
Cash Flow: Only dividends count as cash; gains disappear.
Equity Method:
Balance Sheet: Investment grows with profits but shrinks with dividends.
Income Statement: Profits recognized even without receiving cash.
Cash Flow: Profits subtracted as non-cash adjustments; only dividends remain.
Full Consolidation:
Balance Sheet: Fully merged assets and debts; inflated totals.
Income Statement: Revenues and EBITDA inflated; minority interests must be subtracted.
Investors, beware. Each method has unique pitfalls. Understanding exactly how financial statements change under each scenario isn't just academic curiosity—it's essential protection from expensive mistakes. Unless you enjoy being fooled by imaginary profits and hidden debts, always read financial statements closely.
Part 2: IFRS vs. US GAAP: Important Differences to Remember
This block goes a bit deeper into slight differences between accounting rules, so if you are not a freak about it, you can just jump to the next part. If you thought accounting was complicated enough already, hold onto your seats—because it gets even better. Companies around the world mostly use two accounting frameworks: US GAAP (America doing things its own unique way, as usual) and IFRS (basically. Although the two have grown closer over time, some critical differences remain—especially when it comes to intercorporate investments.
2.1 Fair Value Option for Equity Method Investments
Remember the equity method—where you pick up your share of profits or losses from investees? Under IFRS, this method is typically required whenever a company holds significant influence over an investee. The fair value option (where investments are reported at market price instead) is generally limited to specific situations, like venture capital or private equity funds.
But under US GAAP, accountants decided investors weren't having enough fun already. So they introduced total freedom: any company can choose the fair value option for its equity-method investments. This might sound convenient until your quarterly earnings start swinging wildly based purely on market prices. Investors, beware: under GAAP, earnings stability might vanish faster than your patience reading footnotes.
2.2 Goodwill and Investment Impairment Tests
Goodwill impairment—the accounting version of admitting you probably overpaid for your shiny new acquisition—is handled quite differently under IFRS and US GAAP:
IFRS: Here, impairment testing is relatively straightforward (by accounting standards anyway). The entire investment, goodwill included, is tested together. If the investment is impaired, the total carrying value, including goodwill, is adjusted downward in one fell swoop.
US GAAP: The accountants took a different path (shocking, I know). Goodwill is tested separately from other identifiable assets in a more elaborate two-step process. More complexity, more confusion, more fun for auditors, and more headaches for investors trying to figure out what’s actually going on.
If simplicity matters to you (and as an investor, it should), IFRS has a slight advantage here. If you prefer extra complexity and multiple headaches—congratulations, GAAP has you covered.
2.3 Contingent Liabilities in Business Combinations
Contingent liabilities are those uncertain future obligations lurking in the shadows—think lawsuits, warranty claims, or regulatory fines that might (or might not) materialize. IFRS and US GAAP handle these uncertainties differently:
IFRS: You're forced to recognize contingent liabilities during acquisitions if their fair value can be reliably estimated—even if they're not yet considered "probable." IFRS is essentially saying: “Life’s uncertain, better show the risks clearly right away.”
US GAAP: GAAP takes a stricter view. It only requires recognizing contingent liabilities that are both probable and reasonably estimable. Essentially, GAAP waits until the liability is more certain—often after the damage is already obvious.
This difference sounds subtle, but it affects how transparent companies are about potential future obligations. IFRS reveals uncertainties upfront, while GAAP prefers to surprise you later (usually unpleasantly).
2.4 Non-Controlling Interests (NCI) and Goodwill Measurement: "Full vs. Partial Goodwill"
Here's a big one when it comes to acquisitions and consolidations. Remember the "Non-Controlling Interests" (NCI) we discussed earlier? IFRS and GAAP differ significantly in how they handle goodwill related to these minority shareholders:
IFRS: Companies have a choice—because clearly, we needed even more accounting flexibility. Under IFRS, you can measure NCI either:
Full Goodwill Method: record goodwill for 100% of the subsidiary’s value, including the portion you didn’t buy.
Partial Goodwill Method: record goodwill only for the share you actually purchased, leaving out minority interests.
US GAAP: No choices here, sorry folks. Full goodwill is mandatory, even if you buy just 51% of a business. Yes, that means you recognize goodwill for parts of the subsidiary you didn’t even acquire—because apparently, buying half a cake means you still pay for the icing you didn’t get to eat.
Why should you care? GAAP generally inflates goodwill and equity on acquisitions, potentially making companies look asset-rich when they’ve really only bought partial control. IFRS’s partial goodwill approach can be more conservative, making international comparisons challenging. Investors who fail to adjust for this can badly misjudge valuations.
2.5 Inventory Valuation and Hidden Impacts on Intercorporate Comparisons
Here's an often-overlooked difference that sneaks into intercorporate accounting: inventory valuation methods.
IFRS: LIFO ("last-in, first-out") inventory valuation is strictly prohibited. Companies typically use FIFO ("first-in, first-out") or weighted average cost methods, resulting in clearer, more consistent reporting.
US GAAP: Allows LIFO, FIFO, and weighted average methods. Some US companies prefer LIFO during inflationary periods, as it can lower taxable income—great for reducing tax bills, not so great for investors comparing across borders.
Why does inventory matter in intercorporate investments? Because inventory valuation directly impacts reported profits, asset values, and profit margins. If your investee uses LIFO under GAAP, earnings might look artificially low during inflation. Comparing these results to an IFRS-using competitor could leave you scratching your head and questioning your own sanity.
Part 3: The Consolidation Illusion – Using Kelly Partners as an Example
Let’s talk about Kelly Partners—a textbook example of why understanding consolidation is critical. Kelly Partners is an Australian company specializing primarily in accounting and tax advisory services. Founded by Brett Kelly, the company grows mainly through acquisitions, taking majority stakes—typically just over 50%—in numerous small-to-medium-sized accounting practices. Each acquired firm continues operating semi-independently, while Kelly Partners provides centralized administration, systems, and branding. This creates a sprawling network of subsidiaries, making their financials particularly interesting—and tricky—to analyze.
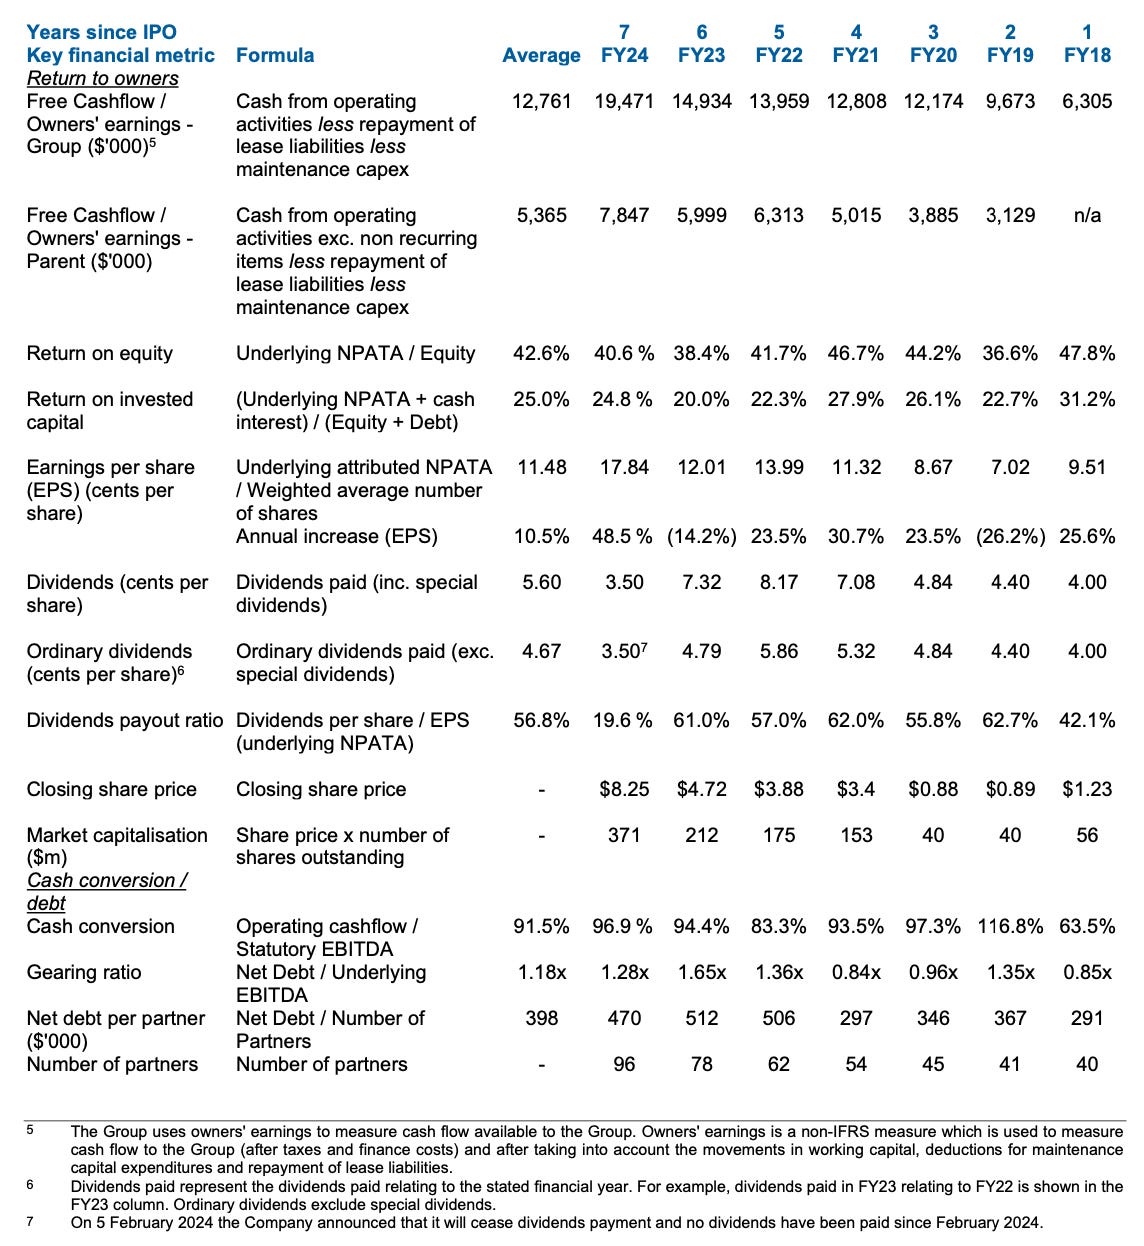
At first glance, Kelly Partners might seem straightforward enough. The firm currently sports a market capitalization around AUD 539 million, which doesn't sound unreasonable for a service-based business with relatively predictable revenues. However, when you scratch beneath the surface, things get complicated—fast.
Thanks to accounting rules on full consolidation, Kelly Partners reports 100% of the earnings of its subsidiaries—even though the company barely owns more than half of these businesses. So, the enticing-looking EBITDA number (around AUD 35 million in their latest annual figures) isn't fully theirs. A casual investor might think, "Wow, trading at around 20x EBITDA—that’s pretty attractive!" But the reality is a lot more sobering. Once you properly adjust EBITDA to reflect only the portion genuinely attributable to Kelly Partners' shareholders, you quickly realize you’re actually paying closer to 70–100 times the real earnings that belong to you. Suddenly, your bargain doesn’t look like much of a bargain at all.
And that’s the key takeaway here: investors must dig deeper and truly understand what they own—or think they own—behind headline numbers.
To its credit, Kelly Partners markets itself as a firm that treats shareholders as genuine partners—much in the style of Berkshire Hathaway or Constellation Software. This approach can be a positive sign, but we must also remain skeptical; after all, telling investors what they want to hear is an easy game to play.
Indeed, Kelly does provide some useful shareholder-focused metrics, clearly showing what portion of cash flow or profits actually belong to investors after accounting for minority interests. This is a commendable practice that helps transparency and is genuinely useful. Metrics like "Free Cashflow to Owners" explicitly separate what truly belongs to shareholders from what doesn’t—something most companies conveniently ignore.
Yet, even Kelly Partners can’t entirely escape the consolidation illusion. Consider their reported "net debt to EBITDA" ratio. On the surface, at around 1.3x EBITDA, this looks fairly conservative, maybe even comforting. But wait a moment—whose EBITDA is that exactly? It’s the consolidated EBITDA, including subsidiaries Kelly Partners barely owns half of. And the net debt of roughly AUD 45–50 million—is it entirely the parent company’s responsibility, or do subsidiaries own part of it?
Given the nature of Kelly’s business model—acquiring small accounting practices that generally don’t need much capital—it seems likely that most (if not all) debt resides with Kelly Partners itself. Thus, comparing consolidated EBITDA with parent-level debt can be dangerously misleading. If we look at their “Owner’s Earnings” or "Free Cashflow attributable to shareholders"—around AUD 5–8 million annually—the debt burden suddenly appears significantly less comfortable. In reality, you might be looking at net debt of approximately AUD 50 million versus only about AUD 5 million in genuinely available cash flow each year. Not quite the reassuring picture you'd initially imagined.
And remember, this is for a business growing organically at about 4%, barely outpacing inflation. Throw in potential disruption from AI and digital accounting platforms, and you start to question whether that sky-high valuation truly makes sense.
The Kelly Partners example perfectly illustrates why investors must look beyond the headline numbers. Consolidation rules aren’t inherently evil—but they can create illusions. Blindly relying on consolidated figures without proper adjustments for minority interests can lead you to significantly overestimate real earnings, underestimate debt risks, and ultimately grossly misjudge a company’s true value.
Understanding these nuances isn't mere financial nitpicking—it’s absolutely crucial to know whether you're buying genuine value or merely paying premium prices for someone else’s profits.
Part 4: Alphabet’s SpaceX Stake and "Paper Profits"
Remember when Alphabet recently reported an eye-popping profit, and investors everywhere suddenly thought Google had cracked the secret to printing money overnight? Yeah, good times. Well, turns out the real story was slightly less magical (and a bit more boring, frankly).
Alphabet’s surprising earnings boost in Q1 2025 wasn’t thanks to some genius new product or breakthrough in AI. Nope, it came from something far more mundane: a revaluation of their stake in SpaceX. Specifically, they booked $9.3 billionin unrealized gains on non-marketable equity securities, which we now know came largely from SpaceX. That single line item ("other income") contributed more to net income than actual operations did in some past quarters. In accounting speak, we call these "unrealized gains." And just like the name suggests, they're unrealized, meaning you don't actually see the money.
But wait… why now? Good question. Alphabet has held a stake in SpaceX for years, but up until now, it kept things vague—tucking the investment away under "other equity securities" in the footnotes and rarely talking about it. Classic "if we don’t mention it, no one will ask" strategy.
So why revalue it now? The answer lies in GAAP rules for non-marketable equity securities. When there's a new observable transaction—for example, a secondary sale of shares in SpaceX or a private funding round—you have to update the fair value of your stake accordingly. Alphabet never clearly discloses how much of SpaceX it owns. We know from old reports they invested around $900 million across 2015 and 2020, but there’s no clear % ownership, no details on governance, and not even a separate line in their financials. This is typical for non-consolidated, passive investments—but not super helpful for investors trying to understand what’s driving results.
And let's be honest: the vagueness probably helps. As long as they don’t disclose too much, they’re not expected to mark it up or down every quarter. But when a big move hits—like this one—they have to account for it, and suddenly it pops into earnings as if it had been there all along.
Why does it matter? Because these profits are unrealized. Alphabet didn’t sell anything. They didn’t receive dividends. Their bank balance didn’t change. And yet, on paper, it looks like they made billions. That $9.3 billion gain flowed straight into net income, which jumped from $23.7 billion in Q1 2024 to $34.5 billion in Q1 2025—almost 50% higher.
It’s the kind of accounting result that sounds great in a press release but doesn’t reflect sustainable, recurring performance. Worse, if you’re running a PE multiple on that net income, or trying to calculate margins, you’ll be completely off unless you adjust for the SpaceX effect.
Always dig into what’s behind the numbers. Earnings driven by operational growth are very different from those boosted by fair value adjustments on private equity stakes. If you're not careful, you could end up building an entire valuation thesis on accounting smoke and mirrors. Unless, of course, you prefer telling stories at parties about how you got rich from paper profits—and then quietly leaving before anyone asks for proof.
In the next article, we’ll take things one step further—and darker. Because while these accounting quirks can be confusing, they can also be abused. Many of the juiciest accounting scandals in recent decades have involved companies using intercorporate accounting tricks to hide debt, inflate earnings, or paint a much prettier financial picture than reality would suggest.
If you enjoyed this piece, please give it a like and share!
Thanks for reading Edelweiss Capital Research! Subscribe for free to receive new posts and support our work.
If you want to stay in touch with more frequent economic/investing-related content, give us a follow on Twitter @Edelweiss_Cap. We are happy to receive suggestions on how we can improve our work.
Thanks for reading Edelweiss Capital Research! Subscribe for free to receive new posts and support my work.
Excellent article that gets to the heart of what investing is, buying a future stream of cash flows (so you better make sure you know what profits and cash flow belongs to you!) ! Thank you for the top notch investor education content!
Hey! This articles are really helpful, thanks a lot! I've been ready for 4 years about similar topics (my background is away from finances, though I thrive reading about it) and going through Berkshire letters and so on. What book would you recommend me for developing my practical skepticism about accounting? I've gone through Valuation McKinsey as well, but they never dig really into the details. Or you are doing it by reasoning yourself? For instance, the IFRS and GAAP differences in the equity stakes. Thank you in advance :) Carlos